Last week the USD broke the 8200 level after testing it a few times.
This week I expect the USD to retest the 8200 level as a resistance before falling further.
For the FX majors, I expect
1) EUR/USD to retrace to 1.318 before attempting any longs to follow the trend
2) GBP/USD to retrace to 1.53 before attempting any longs to follow the trend
3) AUD/USD remains range bound between 0.900 to 0.935. Will have to be careful if the range is broken.
4) USD/JPY to fall further to between 97.0 - 97.5 level.
5) USD/CHF remains supported by the Fib786 at around 0.925.
Volatile week ahead with US Q2 GDP and NFP data coming.
Good luck and be safe.
Monday, 29 July 2013

Sunday, 21 July 2013
Notes for FX Majors for Week 220713 - 260713
- Could be potentially have a short-term upside for both EU and GU to test 1.32 and 1.53 respectively before falling.
- As for AU, it is most likely to be falling to retest the support of around 0.9 level. It remains range bound and resisted by the falling channel.
- USD/JPY, it seems like more upside is coming. However, how the election results will affect the Japanese Yen is still a mystery.
- For the Dollar against the Swiss Franc, it definitely looks like it will be heading down in the short-term to test the level of around 0.935. On the mid-term, Usd/chf looks like it will move up higher.
** The US Dollar Index do looks like it will move lower to test the 82.00 level. So the views above for EU, GU and UC are pretty much in line.
- As for AU, it is most likely to be falling to retest the support of around 0.9 level. It remains range bound and resisted by the falling channel.
- USD/JPY, it seems like more upside is coming. However, how the election results will affect the Japanese Yen is still a mystery.
- For the Dollar against the Swiss Franc, it definitely looks like it will be heading down in the short-term to test the level of around 0.935. On the mid-term, Usd/chf looks like it will move up higher.
** The US Dollar Index do looks like it will move lower to test the 82.00 level. So the views above for EU, GU and UC are pretty much in line.
Tuesday, 9 July 2013
Turn for EUR/USD coming?
EUR/USD

EUR/USD have been falling since last Thursday after ECB kept interest rates unchanged and the rising US dollar due to better NFP numbers.
Currently, EUR/USD is in a strong support zone. I do not expect EUR/USD to break this support zone easily and I am expecting at least a rebound for EUR/USD from this zone this week or latest next week.
The critical level to watch will be 1.2657, and if this level is broken, be careful for more downside.
Thursday, 4 July 2013
No analysis for this weekends.
There will be no analysis this weekends as I'll be enjoying and relaxing in Kukup.
I'll try to post some short-term views on the markets on Sunday evening.
Thank you for support. :)
Darren
I'll try to post some short-term views on the markets on Sunday evening.
Thank you for support. :)
Darren
Sunday, 30 June 2013
EUR/USD & GBP/USD 1HR analysis
EUR/USD

As mentioned last week that the light blue zone will be able to hold the EUR/USD from falling further and has seen to consolidating around the area. Based on the 1hr chart, there is a possibility that EUR/USD might trend slightly lower to flush out longist before rebounding higher. Will be looking out for signals to go long on this pair.
GBP/USD

Despite GBP/USD bounced off strongly from the 78.6% Fibonacci retracement on Friday night, there is still a possibility that GBP/USD will head towards 1.51 before rebounding higher. Will be looking out for signals to go long on this pair.
The strength in USD for the past 2 weeks has been strong and has made EUR/USD and GBP/USD to trend much lower. With reference to other USD pairs such as USD/JPY and USD/CHF, there is a good possibility that the US Dollar is likely to trend slightly higher before coming down. This implies that EUR/USD & GBP/USD might fall slightly lower before turning up.
Do note that all analysis are my personal views and opinions. If you would like to trade, please consult your authorized brokers and use all available analysis at your own discretion.
Good luck in the upcoming week in your trading. :)

GBP/USD
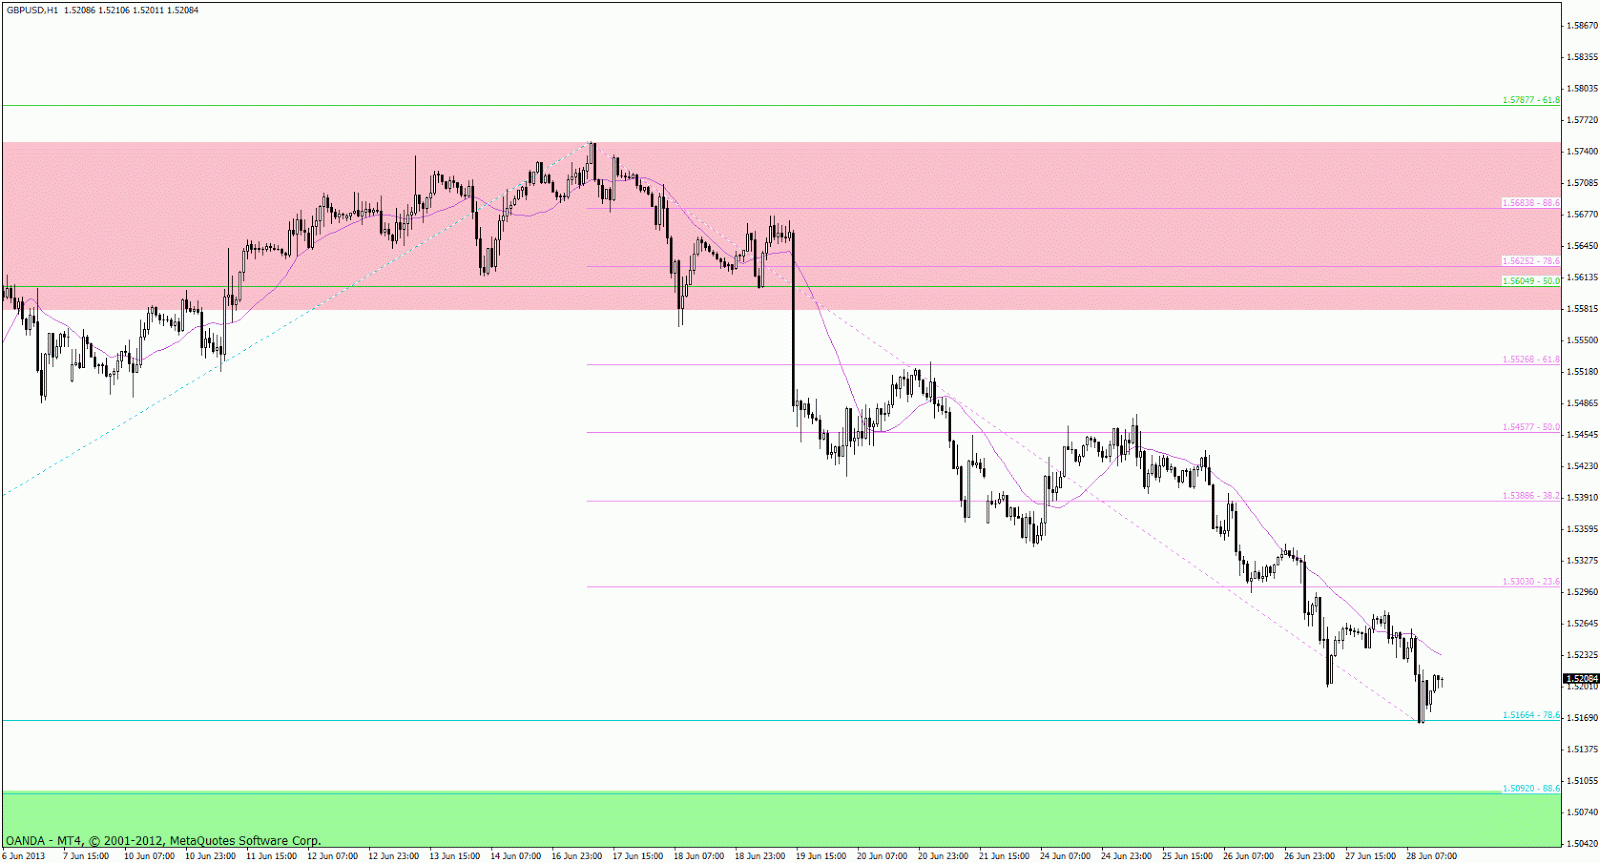
Despite GBP/USD bounced off strongly from the 78.6% Fibonacci retracement on Friday night, there is still a possibility that GBP/USD will head towards 1.51 before rebounding higher. Will be looking out for signals to go long on this pair.
The strength in USD for the past 2 weeks has been strong and has made EUR/USD and GBP/USD to trend much lower. With reference to other USD pairs such as USD/JPY and USD/CHF, there is a good possibility that the US Dollar is likely to trend slightly higher before coming down. This implies that EUR/USD & GBP/USD might fall slightly lower before turning up.
Do note that all analysis are my personal views and opinions. If you would like to trade, please consult your authorized brokers and use all available analysis at your own discretion.
Good luck in the upcoming week in your trading. :)
Major Market Indices
DJI & SNP500


Both the Dow & SNP500 are similar patterns, therefore I have analyze both of them together.
Generally speaking, both indices are still on the mid to long term bull trend.
However, in the short term, there could be some selling pressure coming in. Especially on Friday, both indices got resisted by the 20-day SMA with significant volume. In addition, there was a last hour sell-off on the both the indices on Friday, which personally I believe it is not a bullish sign.
Going lower, the Dow will retest the previous low of around 14550 and SNP500 will retest the previous low of around 1560. We will have to look out whether the 100-day SMA will be able to hold both indices again. If both were to break their previous lows, watch out for the 38.2% Fibonacci retracement. Watch out for the 50% Fibonacci retracement region as well, but the probability of reaching there is not as high.
Hang Seng

The Hang Seng Index dropped very quickly over the last few weeks but managed to recover during the last week of June, mainly due to the Shanghai Stock Exchange.
Currently HSI is in a rebound phase from a very oversold region. Going forward, HSI is facing a series of resistance at around the 21000 level where a falling gap is seen along with the 38.2% Fibonacci retracement as well as the 20-day SMA. If the 21000 resistance level is broken, then next level to watch will be around 21500.
Nikkei 225

Nikkei fell sharply from the 16000 level and has been consolidating between 12500 to 13500 level.
On Friday, Nikkei managed to break the 13500 resistance and also break out of the symmetrical triangle. Nikkei looks ready to go higher but the 50-day SMA and the 38.2% Fibonacci retracement level will resisting Nikkei from going higher.
All in all, Nikkei is still bullish in the mid to long term, but whether it can break the 16000 level to form a new high is still a question mark.
Side note: Nikkei chart look similar to Apple chart in the past.
Do note that all analysis are my personal views and opinions. If you would like to trade, please consult your authorized brokers and use all available analysis at your own discretion.
Good luck in the upcoming week in your trading. :)


Both the Dow & SNP500 are similar patterns, therefore I have analyze both of them together.
Generally speaking, both indices are still on the mid to long term bull trend.
However, in the short term, there could be some selling pressure coming in. Especially on Friday, both indices got resisted by the 20-day SMA with significant volume. In addition, there was a last hour sell-off on the both the indices on Friday, which personally I believe it is not a bullish sign.
Going lower, the Dow will retest the previous low of around 14550 and SNP500 will retest the previous low of around 1560. We will have to look out whether the 100-day SMA will be able to hold both indices again. If both were to break their previous lows, watch out for the 38.2% Fibonacci retracement. Watch out for the 50% Fibonacci retracement region as well, but the probability of reaching there is not as high.
Hang Seng

Currently HSI is in a rebound phase from a very oversold region. Going forward, HSI is facing a series of resistance at around the 21000 level where a falling gap is seen along with the 38.2% Fibonacci retracement as well as the 20-day SMA. If the 21000 resistance level is broken, then next level to watch will be around 21500.
Nikkei 225

On Friday, Nikkei managed to break the 13500 resistance and also break out of the symmetrical triangle. Nikkei looks ready to go higher but the 50-day SMA and the 38.2% Fibonacci retracement level will resisting Nikkei from going higher.
All in all, Nikkei is still bullish in the mid to long term, but whether it can break the 16000 level to form a new high is still a question mark.
Side note: Nikkei chart look similar to Apple chart in the past.
Do note that all analysis are my personal views and opinions. If you would like to trade, please consult your authorized brokers and use all available analysis at your own discretion.
Good luck in the upcoming week in your trading. :)
Saturday, 29 June 2013
Review on past week analysis for both Singapore stocks & EURUSD.
Firstly, I would like to thank my readers that have been visiting my blog.
Generally, the STI market is pretty unchanged (slightly higher) therefore I believe there is no need for a re-analysis for the counters that I have did last week.
Click stocks and EURUSD to read last week analysis.
However, I would still post any chart analysis if requested.
So let's review my last week analysis.
STI - I still remain bearish on this pair to at least hit 3000 despite the small rebound for the entire week.
SembMar - Still pretty much supported above the level of around 4.08.
KepCorp - Still holding on to the rising trendline but seems like it would break down anytime.
NOL - Still remain in a long-term consolidation phase.
Genting SP - Break of 1.31 will exert more immediate selling. Trend remains bearish.
Capitaland - As expected, it remained supported between 2.90 - 3.05. But also a retest of the rising trend line was seen. On Friday night MAS announced a new round of property cooling measures, so therefore property counters MIGHT get a hit again.
Banks - remain supported by the 200-day SMA. However, all 3 banks individual charts look pretty bad for longist, shorts seems to be in place with significant volume. Be wary of the banks.
Lastly, for EURUSD, it seems well supported by my blue region. And for the upcoming week I might look out for signals on whether this support region will break or hold the currency pair.
Generally, the STI market is pretty unchanged (slightly higher) therefore I believe there is no need for a re-analysis for the counters that I have did last week.
Click stocks and EURUSD to read last week analysis.
However, I would still post any chart analysis if requested.
So let's review my last week analysis.
STI - I still remain bearish on this pair to at least hit 3000 despite the small rebound for the entire week.
SembMar - Still pretty much supported above the level of around 4.08.
KepCorp - Still holding on to the rising trendline but seems like it would break down anytime.
NOL - Still remain in a long-term consolidation phase.
Genting SP - Break of 1.31 will exert more immediate selling. Trend remains bearish.
Capitaland - As expected, it remained supported between 2.90 - 3.05. But also a retest of the rising trend line was seen. On Friday night MAS announced a new round of property cooling measures, so therefore property counters MIGHT get a hit again.
Banks - remain supported by the 200-day SMA. However, all 3 banks individual charts look pretty bad for longist, shorts seems to be in place with significant volume. Be wary of the banks.
Lastly, for EURUSD, it seems well supported by my blue region. And for the upcoming week I might look out for signals on whether this support region will break or hold the currency pair.
Subscribe to:
Posts (Atom)